Visual Semantic Textual Similariy
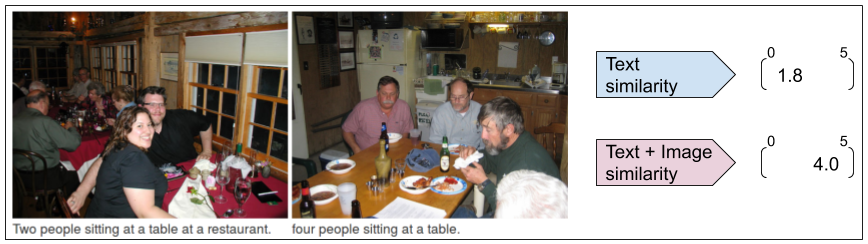
We present present Visual Semantic Textual Similarity (vSTS) that extends the Semantic Textual Similarity to the visual modality, a task and dataset which allows to study whether better sentence representations can be built when having access to the corresponding images, in contrast with having access to the text alone. The example below illustrates the need to re-score the similarity values, as the text-only similarity is not applicable to the multimodal version of the dataset: the annotators return a low similarity when using only text, while, when having access to the corresponding image, they return a high similarity
The vSTS dataset aims to become a standard benchmark to test the contribution of visual information when evaluating the similarity of sentences and the quality of multimodal representations, allowing to test the complementarity of visual and textual information for improved language understanding.
Visual STS Dataset
The vSTS assesses the degree to which two sentences are semantically equivalent to each other. The annotators measure the similarity among sentences with the help of associated images. The annotations of similarity were guided by the scale shown in the table below, ranging from 0 for no meaning overlap to 5 for meaning equivalence. Intermediate values reflect interpretable levels of partial overlap in meaning.
| Similarity | definitions |
|---|---|
| 5 | Completely equivalent: They mean the same thing. |
| 4 | Mostly equivalent: Some unimportant details differ. |
| 3 | Roughly equivalent: Some important information differs/missing. |
| 2 | Not equivalent but share some details. |
| 1 | Not equivalent but on the same topic. |
| 0 | Completely dissimilar. |
Data Collection
The data collection of sentence-image pairs comprised several steps, including the selection of pairs to be annotated, the annotation methodology, and a final filtering stage.
-
Sampling data for manual annotation. We make use of two well-known image-caption datasets. On one hand, Flickr30K dataset and Microsoft COCO dataset, each one contains 5 manually generated captions per images.
-
Manual annotations. In order to annotate the sample of 2639 pairs, we used Amazon Mechanical Turk (AMT). We got up to 5 scores per item, and we discarded annotators that showed low correlation with the rest of the annotators ($\rho < 0.75$).
-
Selection of difficult examples. We defined easiness as an amount of discrepancy provided by an example regarding the whole dataset. We removed 30\% of the easiest examples and create a more challenging dataset of 1858 pairs.
The full dataset comprises both the sample mentioned above and the 819 pairs from our preliminary work, totalling 2677 pairs. The figure below shows the final item similarity distribution. Although the distribution is skewed towards lower similarity values, we consider that all the similarity ranges are sufficiently well covered.
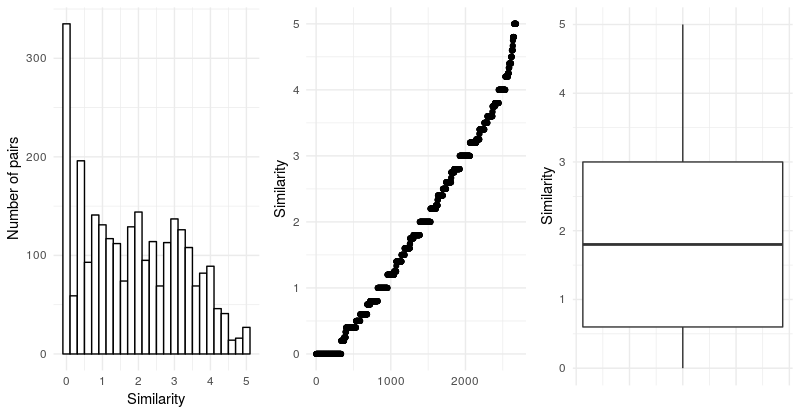
Average similarity of the dataset is 1.9 with a standard deviation of 1.36 points. The dataset contains 335 zero-valued pairs out of the 2677 instances, which somehow explains the lower average similarity.
Download
- For the full documentation of the dataset and its format please refer to our Github repository.
- Click here to download vSTS dataset.
Explore dataset
TBD
Paper
Evaluating Multimodal Representations on Visual Semantic Textual Similarity. Oier Lopez de Lacalle, Ander Salaberria, Aitor Soroa, Gorka Azkune and Eneko Agirre. European Conference on Artificial Intelligence (ECAI-20)
@proceedings{DBLP:conf/ijcai/2018,
  title     = {Proceedings of the Twenty-third European Conference on
               Artificial Intelligence, {ECAI} 2020, June 8-12, 2020, Santiago Compostela,
               Spain},
  author    = {Oier Lopez de Lacalle and Ander Salaberria and Aitor Soroa and Gorka Azkune and Eneko Agirre}
  year      = {2020},
}
Authors
Oier Lopez de Lacalle, Ander Salaberria, Aitor Soroa, Gorka Azkune and Eneko Agirre.
Results
Results below are reported in the ECAI-2020 paper. The code of the experiments will be available soon in the Github repository.
Models are evaluated in two scenarios:
-
Unsupervised scenario: Models do not use available training data of the task. Tipically, representation are learned in another task and similarity is computed with the cosine.
-
Supervised scenario: Models make use of available annotated data to learn and tune parameters.
Unsupervised scenario
| Model | Modality | train | dev | test |
|---|---|---|---|---|
| glove | text | 0.576 | 0.580 | 0.587 |
| bert | text | 0.641 | 0.593 | 0.612 |
| gpt-2 | text | 0.198 | 0.241 | 0.210 |
| use | text | 0.732 | 0.747 | 0.720 |
| vse++ | text | 0.822 | 0.812 | 0.803 |
| resnet-152 | image | 0.638 | 0.635 | 0.627 |
| vse++ image | image | 0.677 | 0.666 | 0.662 |
| glove+resnet-152 | mmodal | 0.736 | 0.732 | 0.730 |
| bert+resnet-152 | mmodal | 0.768 | 0.747 | 0.745 |
| use+resnet-152 | mmodal | 0.799 | 0.806 | 0.787 |
| vse++ +resnet-152 | mmodal | 0.846 | 0.837 | 0.826 |
Supervised scenario
| Model | Modality | train | dev | test |
|---|---|---|---|---|
| glove | text | 0.819 | 0.744 | 0.702 |
| bert | text | 0.888 | 0.775 | 0.781 |
| gpt-2 | text | 0.265 | 0.285 | 0.246 |
| use | text | 0.861 | 0.824 | 0.810 |
| vse++ | text | 0.883 | 0.831 | 0.825 |
| resnet-152 | image | 0.788 | 0.721 | 0.706 |
| vse++ image | image | 0.775 | 0.703 | 0.701 |
| concat: glove+resnet-152 | mmodal | 0.899 | 0.830 | 0.794 |
| concat: bert+resnet-152 | mmodal | 0.889 | 0.805 | 0.797 |
| concat: vse++ +resnet-152 | mmodal | 0.915 | 0.864 | 0.852 |
| concat: use+resnet-152 | mmodal | 0.892 | 0.859 | 0.841 |
| project: glove+resnet-152 | mmodal | 0.997 | 0.821 | 0.826 |
| project: bert+resnet-152 | mmodal | 0.996 | 0.825 | 0.827 |
| project: use+resnet-152 | mmodal | 0.998 | 0.850 | 0.837 |
| project: vse++ +resnet-152 | mmodal | 0.998 | 0.853 | 0.847 |
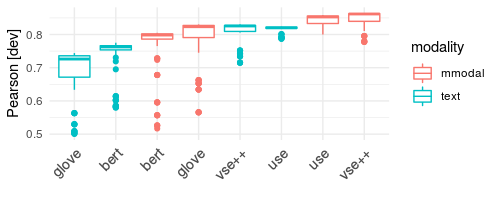
Image contribution